🛒 Best Price Today on Amazon
Prime members get fast, free shipping on everything above, plus member-only deals. New members get a 30-day free trial — cancel anytime.
A good GPU and CPU temp monitor helps you catch overheating, cooling problems, thermal throttling, unstable overclocks, and failing fans before they become serious. The best tools provide accurate real-time sensor readings, clear minimum and maximum values, logging, alerts, and optional in-game overlays without adding unnecessary system load.
Quick answer: For most people in 2026, the best gpu and cpu temp monitor is the Tool — our #1 rated choice. See the full ranked comparison, alternatives and buying advice below.
Best GPU And CPU Temp Monitor Tools Compared
| Tool | Best For | CPU Temps | GPU Temps | Overlay | Logging |
|---|---|---|---|---|---|
| HWiNFO | Best Overall | Yes | Yes | Yes | Yes |
| MSI Afterburner + RTSS | Gaming Overlay | Yes | Yes | Yes | Yes |
| Open Hardware Monitor | Open-Source Monitoring | Yes | Yes | Limited | Yes |
| Core Temp | Lightweight CPU Monitoring | Yes | Limited | No | Basic |
HWiNFO
Best For: Best overall GPU and CPU temperature monitoring
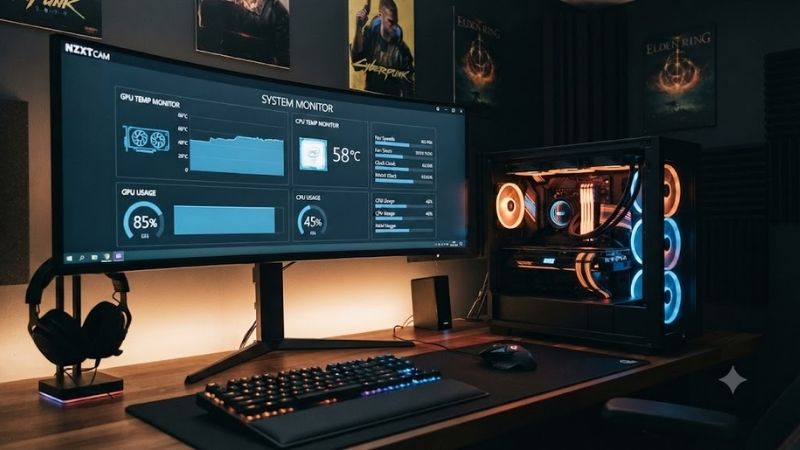
HWiNFO is one of the most comprehensive hardware-monitoring utilities available for Windows. It reads a huge range of sensors from the CPU, GPU, motherboard, storage, memory, cooling hardware, and supported power components, making it a strong choice for both casual temperature checks and detailed troubleshooting.
Its sensor window can display current, minimum, maximum, and average values at the same time. This makes it especially useful when testing a PC under load because you can launch a game or stress test, return to HWiNFO later, and immediately see the hottest recorded CPU and GPU temperatures.
Key Features
- Real-time CPU temperature monitoring
- GPU core temperature monitoring
- GPU hotspot and VRAM sensors on supported hardware
- Motherboard and VRM temperatures
- SSD and NVMe temperature readings
- Fan-speed monitoring
- Voltage and power readings
- Minimum, maximum, and average values
- Data logging
- Custom alerts
- System-tray monitoring
- On-screen display support
- Detailed hardware identification
What Makes It Different
Sensor depth is the biggest advantage. Many monitoring tools show one CPU temperature and one GPU temperature, while HWiNFO can expose several readings for the same component. On supported GPUs, this can include core temperature, hotspot temperature, memory temperature, power, fan speed, clocks, and load.
This extra information is valuable because a normal GPU core temperature does not always tell the whole story. A card may have acceptable core temperature while its hotspot or memory temperature is significantly higher. Similarly, CPU package temperature can be more useful than focusing on one individual core.
HWiNFO also supports logging sensor data over time. A user troubleshooting random shutdowns, game crashes, or performance drops can record temperatures and clocks during a long session and inspect the data later instead of trying to watch every value in real time.
Pros
- Extremely detailed sensor coverage
- Excellent CPU and GPU monitoring
- Current, minimum, maximum, and average readings
- Logging and alerts
- Supports modern hardware
- Useful for diagnostics and stress testing
- Lightweight for the amount of information provided
Cons
- Sensor list can overwhelm beginners
- Interface is more technical than simple monitoring apps
- Some readings require knowledge to interpret correctly
- More features than casual users may need
Use Case and Who It’s For
HWiNFO is the best option for enthusiasts, PC builders, overclockers, technicians, and users diagnosing heat-related performance problems. It also works well for ordinary users who simply want to check temperatures, provided they are comfortable hiding unnecessary sensors and focusing on CPU package and GPU temperature values.
MSI Afterburner With RivaTuner Statistics Server
Best For: Best GPU and CPU temp monitor for gaming
MSI Afterburner is best known as a GPU tuning utility, but its monitoring system is one of the most useful options for gamers. When combined with RivaTuner Statistics Server, it can display CPU and GPU temperatures directly over a game, along with utilization, clocks, memory usage, frame rate, and frame-time information.
The software works with graphics cards from multiple manufacturers rather than requiring an MSI-branded GPU. This makes it useful for NVIDIA, AMD, and many laptop gaming setups where users want to watch temperature and performance behavior during actual gameplay instead of relying only on desktop sensor windows.
Key Features
- Real-time GPU temperature
- CPU temperature monitoring
- GPU usage
- CPU usage
- Core and memory clocks
- VRAM usage
- Fan-speed monitoring
- Frame-rate display
- Frame-time monitoring
- Customizable in-game overlay
- Monitoring graphs
- Hardware logging
- Works with RTSS
What Makes It Different
The in-game overlay is the main reason to choose MSI Afterburner. Instead of leaving a monitoring window open on another screen, users can place key readings in a corner of the game. This makes it easy to see whether high temperatures occur during a demanding scene, loading transition, or extended multiplayer session.
The overlay is also useful for diagnosing performance problems. If frame rate drops while GPU temperature rises and clock speed falls, thermal throttling becomes one possible explanation. If GPU usage falls while one or more CPU cores are heavily loaded, the bottleneck may be elsewhere.
RivaTuner Statistics Server provides extensive control over overlay appearance. Users can adjust size, placement, visibility, and the combination of statistics shown, allowing a compact display with only CPU temperature, GPU temperature, and FPS or a much more detailed diagnostic layout.
Pros
- Excellent in-game overlay
- Tracks GPU and CPU temperatures
- Displays FPS and frame times
- Highly customizable
- Useful for gaming diagnostics
- Compatible with many GPUs
- Free to use
Cons
- Setup is more involved than simple monitors
- RTSS is required for the full overlay experience
- Overclocking controls may confuse beginners
- Easy to display too much information at once
Use Case and Who It’s For
MSI Afterburner is ideal for gamers who want to understand what their hardware is doing while a game is actually running. It is particularly useful after upgrading a GPU, changing a cooling configuration, undervolting, overclocking, or troubleshooting sudden FPS drops during long gaming sessions.
Open Hardware Monitor
Best For: Best open-source hardware monitoring option
Open Hardware Monitor is a free open-source utility built around direct hardware sensor monitoring. It can track temperatures, fan speeds, voltages, load, clock speeds, and other system data from supported CPUs, GPUs, motherboards, storage drives, and additional hardware.
The interface uses a tree structure that groups readings under each hardware component. This makes it easy to expand only the CPU and GPU sections when temperature is the main concern, while more advanced users can inspect fan speeds, drive health, memory usage, and other sensor categories.
Key Features
- CPU core temperatures
- CPU package data
- GPU temperatures
- GPU hotspot and memory data on supported hardware
- Fan-speed readings
- Voltage monitoring
- Clock-speed monitoring
- SSD and HDD temperatures
- Tray icons
- CSV logging
- Portable mode
- Built-in web server
- Open-source codebase
What Makes It Different
Open-source development is the main distinction. Users who prefer software with publicly inspectable code may find Open Hardware Monitor more attractive than proprietary alternatives. The project also offers flexible access to sensor data through features such as a built-in web server and WMI integration.
Portable operation is another useful feature. Technicians can keep the application on a USB drive and run it on multiple computers without building an elaborate installation on each machine. That makes it practical for checking temperatures on client systems or newly assembled PCs.
The interface is simpler than HWiNFO but still provides more than basic CPU-only monitoring. Users can inspect several hardware categories without opening multiple applications, which is convenient when they want to see whether a heat problem is isolated to the CPU or affects the GPU, storage, or motherboard as well.
Pros
- Free and open source
- CPU and GPU temperature monitoring
- Portable mode
- CSV logging
- Supports many hardware categories
- Built-in remote web access
- Straightforward sensor tree
Cons
- Hardware support may lag behind specialist tools
- Interface looks utilitarian
- Some sensors require administrator access
- Less polished overlay experience than MSI Afterburner
Use Case and Who It’s For
Open Hardware Monitor is a good choice for users who want a transparent, lightweight monitoring application without advanced tuning controls. It also works well for technicians, enthusiasts who prefer open-source utilities, and anyone who wants one portable tool for checking several hardware temperatures.
Core Temp
Best For: Lightweight CPU temperature monitoring
Core Temp focuses primarily on processor temperature rather than acting as a complete system-monitoring suite. It reads thermal data from the CPU’s built-in digital thermal sensors and can display the temperature of individual processor cores, making it useful when the CPU is the main component you want to troubleshoot.
The application is extremely lightweight compared with full hardware-monitoring packages. That makes it attractive for older PCs, office systems, or users who want a small utility running in the background without opening a large sensor dashboard.
Key Features
- Per-core CPU temperature readings
- Processor identification
- Real-time thermal monitoring
- Minimum and maximum values
- System-tray temperature display
- Lightweight interface
- Low resource usage
- Support for common Intel and AMD processors
What Makes It Different
Simplicity is Core Temp’s biggest advantage. A user worried about CPU temperature does not need to navigate through GPU power rails, storage statistics, network data, and motherboard sensors. The program focuses on processor thermals and presents the relevant information with minimal distraction.
Per-core readings can also help identify unusual behavior during stress testing. Modern processors do not always distribute workload and temperature evenly across every core, so seeing individual values can reveal whether one core consistently runs hotter than the rest.
The limitation is equally clear: Core Temp is not the best all-in-one choice when GPU temperature is equally important. Users building a complete CPU and GPU monitoring setup should pair it with another tool or choose HWiNFO or MSI Afterburner instead.
Pros
- Very lightweight
- Easy to understand
- Per-core CPU readings
- Minimal system overhead
- Useful tray display
- Good for CPU troubleshooting
Cons
- Primarily focused on CPU temperature
- Not a complete GPU monitoring solution
- Limited compared with HWiNFO
- Less suitable for gaming overlays
Use Case and Who It’s For
Core Temp is best for users who only need quick CPU temperature information. It works well on office PCs, older systems, and troubleshooting sessions where processor cooling is the main concern, but it is less suitable as the only monitoring tool for a gaming PC with a powerful graphics card.
Which GPU And CPU Temperatures Should You Monitor?
The most useful CPU reading is usually CPU package temperature or the manufacturer’s primary CPU temperature sensor. Per-core temperatures are useful for detailed diagnosis, but the hottest core or package reading generally gives the clearest picture of cooling performance during a heavy workload.
For GPUs, core temperature is the basic value to watch. Modern cards may also expose a hotspot or junction temperature that represents a hotter internal point on the chip. Some cards can report memory-junction or VRAM temperature as well, which becomes useful during rendering, AI workloads, or memory-intensive gaming.
Do not compare different sensor types as if they should have identical values. A GPU hotspot is expected to be hotter than the normal GPU core reading, and individual CPU cores can differ from package temperature. The important comparison is whether each sensor remains within the safe operating range specified for that hardware.
How To Monitor CPU And GPU Temperature While Gaming
The easiest method is MSI Afterburner with RivaTuner Statistics Server. Enable the CPU temperature, GPU temperature, GPU usage, CPU usage, clock speeds, and frame rate values you want, then mark them for display in the on-screen overlay.
Keep the overlay simple at first. CPU temperature, GPU temperature, GPU usage, and FPS are enough for many users. Add hotspot, power, VRAM, frame time, and individual CPU-core values only when troubleshooting a specific performance issue.
Another option is to leave HWiNFO running in the background and use its minimum and maximum columns after finishing a gaming session. This is less distracting than an overlay and provides an easy way to see the highest temperatures reached without constantly watching numbers while playing.
How To Choose A GPU And CPU Temp Monitor
Choose HWiNFO For Maximum Detail
HWiNFO should be the first choice when you want one monitoring application capable of showing nearly every available sensor. It is ideal for new PC builds, thermal testing, fan troubleshooting, and checking CPU, GPU, storage, and motherboard temperatures together.
Choose MSI Afterburner For Gaming
MSI Afterburner is better when the main goal is seeing temperature and performance while a game is running. The customizable RTSS overlay provides immediate context that a separate desktop monitoring window cannot match.
Choose Open Hardware Monitor For Open Source
Open Hardware Monitor is a strong option for users who value open-source software and portable monitoring. It covers considerably more hardware than a CPU-only tool while maintaining a relatively simple interface.
Choose Core Temp For Simplicity
Core Temp makes sense when CPU thermals are the only concern. It starts quickly, uses few resources, and avoids presenting a long list of unrelated sensors.
FAQ
What is the best GPU and CPU temp monitor?
HWiNFO is the strongest overall choice because it monitors CPU, GPU, motherboard, storage, fan, voltage, clock, and power sensors while supporting minimum, maximum, average values, alerts, logging, tray displays, and on-screen monitoring.
What is the best temperature monitor for gaming?
MSI Afterburner with RivaTuner Statistics Server is one of the best options for gaming because it can place CPU and GPU temperatures directly on top of the game alongside FPS, utilization, clock speeds, VRAM usage, and other statistics.
Can Windows show CPU temperature by itself?
Windows provides some hardware and performance information, but it does not offer the same detailed CPU-temperature monitoring as dedicated utilities. A sensor tool such as HWiNFO, Core Temp, or Open Hardware Monitor provides much more useful thermal information.
Is 80°C too hot for a CPU?
Not necessarily. Many modern processors can operate safely around that temperature under heavy load. Safe limits depend on the exact CPU model, so compare the reading with the processor’s official maximum temperature and check whether thermal throttling is occurring.
Is 80°C too hot for a GPU?
For many modern graphics cards, approximately 80°C under sustained load can still be within the normal operating range. Cooler operation is generally preferable, but the correct limit depends on the specific GPU, cooler, hotspot temperature, and manufacturer design.
Should I monitor GPU hotspot temperature?
Yes, when the GPU exposes it. Hotspot temperature provides additional information about the hottest measured point on the GPU die and can help diagnose cooling problems that may not be obvious from the standard core-temperature reading alone.
Conclusion
The best GPU and CPU temp monitor depends on how much information you need. HWiNFO offers the strongest all-around sensor coverage, MSI Afterburner excels at in-game monitoring, Open Hardware Monitor is a flexible open-source option, and Core Temp remains excellent for lightweight CPU checks. For most gaming PCs, HWiNFO plus MSI Afterburner covers nearly every thermal-monitoring need.
Ready to decide? Our #1 pick for 2026 is the Tool.
Live price & availability on Amazon.