🛒 Best Price Today on Amazon
Prime members get fast, free shipping on everything above, plus member-only deals. New members get a 30-day free trial — cancel anytime.
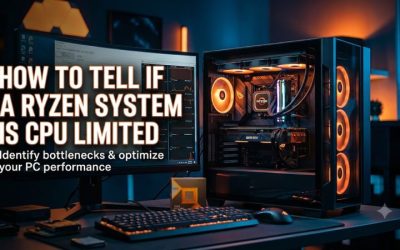
Run the same uncapped game scene twice and lower only the render resolution on the second pass. To learn how to tell if a Ryzen system is CPU limited, check whether GPU work drops while frame times barely improve. Then look for a busy game thread and rule out engine caps, memory pressure, and thermal or power limits.
What is the quickest useful test for a CPU limit?
Lower render resolution while holding the rest of the scene and graphics settings constant. If GPU work falls visibly but frame times barely improve, investigate what is keeping the game from submitting frames faster.
Run a controlled render-resolution comparison
- What to do Capture a repeatable route at your normal settings. Run it again at a clearly lower render scale or resolution without changing crowd density, draw distance, or other settings.
- Expected result GPU workload falls. If the frame rate rises meaningfully and slow frames improve, the original scene depended substantially on GPU throughput.
- If the check fails If the frame rate stays flat, first verify that the lower setting genuinely changed GPU workload. Then check frame caps and look for CPU, memory, or engine constraints.
Use a built-in benchmark, recorded replay, or repeatable offline section when possible. Multiplayer matches can shift behavior because players, effects, and world state vary. Multiple comparable samples help when a live match is the only scene that reveals the problem.
For this diagnostic, turn off frame generation and dynamic resolution when the game offers those controls. Use the same upscaling mode across runs or temporarily turn it off. Frame generation can change the displayed FPS, and dynamic resolution can counteract your intended test change.
Start with a substantial enough resolution difference to move GPU work. A minor slider change might leave GPU Busy within normal variation. When testing at a different output resolution, confirm that the application, display mode, and frame cap remained consistent.
Remove obvious frame caps before interpreting a plateau
- What to do Check the game limiter, V-Sync, driver profile, and any external overlay limiter. Temporarily run the diagnostic uncapped if the game supports it.
- Expected result The measured frame rate is free to move when you lower GPU work. The scene can reveal a performance ceiling that a cap previously concealed.
- If the check fails If the rate stays exactly at a common limit, inspect the game’s engine cap, foreground focus, menu settings, and current display mode.
A frame cap intentionally creates wait time. At 120 FPS, regular presented frames are roughly 8.33 milliseconds apart. If both runs sit close to that interval with headroom on the GPU, the cap is the likely explanation.
A monitor can report a particular refresh rate even while the game renders at a different rate. Check game FPS and presented frame time alongside the display setting. Use identical limiter settings for both tests, and restore your normal cap afterward if you use it for comfort or consistency.
Repeat the part of the game where performance matters
Some games change which component limits them from one scene to the next. A dense city with many simulated characters may be CPU limited, while an outdoor scene with detailed lighting may be GPU limited. A brief run in the menu tells you very little about either scene.
Choose the route associated with your complaint. A benchmark that produces high averages can miss the combat scenes with poor frame pacing. A second capture from one representative demanding area makes the result more useful than a whole-session average.
Check the same conditions more than once. If the difference between two baseline runs is almost as large as the resolution test’s result, collect another pass. Report the range or note that the difference is inconclusive rather than basing an upgrade on one noisy run.
Which readings help confirm that the CPU is the limit?
Use frame timing to identify the symptom. Then compare GPU work and the game’s slowest intervals against CPU thread activity and effective clock behavior. An average utilization number on its own is an incomplete diagnosis.
Compare frame time and GPU Busy
Use a capture tool that exposes a frame-time metric and GPU Busy where supported. Intel PresentMon can report the time the GPU was actively executing work for the target process and the interval between Present calls. Keep the same metrics and capture tool across your test runs.
| What you observe | What it suggests | What to check next |
|---|---|---|
| Frame time and GPU Busy move together | GPU work often dominates the measured segment | Lower render resolution and repeat |
| GPU Busy drops sharply while frame time changes little | Something outside GPU execution may be limiting submission or pacing | Check caps, CPU threads, engine waits, and memory |
| A few long frames appear in both runs | A localized event can dominate the slowest frames | Identify scene changes, streaming, or compilation |
| FPS stays fixed at a known target | A cap or synchronization behavior may control pacing | Check the game, driver, and external limiter |
| CPU clock or temperature limits coincide with the slowdown | A system configuration or cooling constraint may reduce CPU throughput | Inspect temperatures, effective clocks, and limiter flags |
A gap between GPU Busy and frame time is one clue. Queuing, engine waits, synchronization, and frame caps can all contribute. CPU and GPU work on different frames can overlap, so subtracting GPU Busy from frame time does not give a clean measurement of CPU execution time.
Look for a pattern across many frames in the same part of the scene. A pattern that survives lowering GPU load and moves when you change a CPU-heavy setting gives stronger evidence than one snapshot from an overlay. GPU telemetry availability and labels can vary by capture tool and hardware.
Check for one heavily used thread or a scheduling bottleneck
Windows calculates total CPU utilization across logical processors. A game can depend on one main thread or a small group of workers while the other cores remain available. A Ryzen system can therefore be limited by CPU work even when total usage looks moderate.
- What to do Inspect per-logical-processor or per-thread activity alongside the game’s frame-time spikes and active-core effective clocks.
- Expected result The signal shows whether a small group of busy workers, scheduling delays, or another dependency lines up with slower frames.
- If the check fails If activity jumps between logical processors, inspect the game process or a thread-level trace where possible. Do not require one graph to show exactly 100%.
The scheduler can move a busy thread between cores during a sample. That can make several utilization graphs look moderately busy rather than one graph pinned for the entire run. Simultaneous multithreading further complicates a simple interpretation of any one utilization number.
If the capture tool exposes CPU timing or game-thread detail, compare it with the frame-time log. A thread can wait on memory, synchronization, I/O, or another thread and still limit progress.
A CPU-side limit describes where the frame is waiting in that workload. It does not automatically tell you how much a faster CPU will help.
Read effective clocks and package behavior under load
Check active-core effective clocks in HWiNFO or another compatible monitor. A lower clock on a sleeping or unused core is normal. A sustained drop across the cores doing the work, at the same demand, is more relevant.
Check temperatures, throttle indicators, and any power or current limits the platform exposes. A CPU may be the immediate limit because the system is forcing it to slow down.
Cooling or a restrictive preset can explain that result. A processor upgrade would address a different question.
Keep the monitoring setup consistent. An overlay, too many polling tools, or background recording can affect frame pacing or load. Use the lightest setup that still exposes the data you need, then collect a repeat run if the diagnosis is sensitive to small differences.
What else can make a Ryzen system look CPU limited?
Before blaming the processor, test for conditions that leave the GPU with fewer frames to work on. These include deliberate waiting, asset streaming, shader compilation, and pressure on memory or VRAM.
Identify first-run stutter and asset streaming
If the long frame occurs only after a patch, after changing settings, or the first time you visit a scene, shader preparation or asset loading can be relevant. Repeat the same route after any normal compilation completes, and compare first-pass and warm-pass behavior.
- What to do Record when and where the stutter occurs. Replay that section without changing resolution, quality, or storage location.
- Expected result A one-time event becomes distinguishable from a steady CPU-side ceiling.
- If the check fails If spikes recur at the same stream points, check storage activity, available RAM, VRAM pressure, and game-specific behavior before attributing them to the CPU.
Average FPS can look fine even when a few frames take far longer than the rest. Use the frame-time trace or a consistent slow-frame statistic from the same tool. If choosing a percentile metric, keep its definition consistent throughout the comparison.
Rule out VRAM and memory pressure
GPU utilization can fall when resource uploads, memory eviction, or storage waits interrupt work. This can look like an underused GPU in the overlay. Check whether the stutter coincides with higher GPU memory demand or system memory pressure.
Keep render resolution fixed and test a lower texture setting if VRAM is the suspected cause. Check whether the slow frames improve even when the central frame rate changes little. Texture changes may alter streaming behavior, so repeat a warmed route.
If you suspect system memory, check how much RAM is available and whether the system is paging heavily during the slowdown. Compare a normal run with unnecessary background applications closed. Use operating-system measurements and the captured scene instead of assuming that one high memory-use number establishes a bottleneck.
Change a game setting with a plausible CPU cost
Population density, simulation detail, or view distance can affect CPU work in some engines. The same setting can also affect GPU work. Start with one change and compare both GPU Busy and frame time before drawing a conclusion.
- What to do Hold render resolution fixed, lower one likely CPU-heavy setting, and rerun the same difficult section.
- Expected result The slow section improves while the GPU measurement and scene show a pattern consistent with reduced CPU or engine work.
- If the check fails If the setting mainly changes GPU work on your game, restore it and test another setting. Review the engine’s capture evidence when available.
A useful comparison is one you can explain. For example, lowering crowd density in the same busy area may reduce simulation or draw-call work.
If the game also changes what it renders, compare the shift in both types of timing. Treat mixed constraints as mixed rather than forcing one label on the entire game.
How do the results translate into a decision?
Use the test to determine whether a change improves the experience you actually want. A sustained CPU-side limit, a one-time stall, and a hard game cap call for different responses.
Compare the original goal with the measured ceiling
For a high-refresh target, work in frame times as well as FPS. A 240 FPS target corresponds to about 4.17 milliseconds per frame. If the relevant scene’s baseline remains well above that even when GPU work drops, the CPU-side ceiling can matter for that target.
Record the average and the slow frames separately. A build can average 240 FPS while dropping below the target in crowded or chaotic scenes. If your concern is consistent motion or input response, consider the demanding parts of gameplay rather than the best-case average.
If the current game is already at a deliberate cap you prefer, the measured headroom can also be useful. Use the uncapped comparison to see what the system can do, then restore the actual playing settings. A cap hides additional throughput when its target is already met.
Try changes in the order the evidence supports
- What to do Restore normal cooling performance, remove unnecessary competing tasks for the test, and verify the supported memory and power setup before judging the hardware.
- Expected result The comparison reflects what the Ryzen system can sustain under a normal configuration.
- If the check fails Fix the specific issue revealed by the log. A throttle flag, paging event, or limiter should be addressed separately before repeating the resolution test.
If the CPU side remains the limit at your required frame rate across multiple scenes and sensible settings, compare CPU performance in that specific game. Different Ryzen models can trade frame rate and low-percentile performance differently depending on engine behavior and memory. A generic CPU ranking provides weaker guidance than a matched benchmark in the same game.
If lower resolution produces a clear and repeatable improvement, GPU or render settings remain a useful lever. If both CPU and GPU changes can improve different portions of the route, record which part matters most. Upgrading a component can simply move the tightest constraint elsewhere.
Keep a short result you can reproduce
Write down the CPU, graphics card, game build, route, frame cap, graphics settings, and render scales tested. Include the frame-time statistic and GPU Busy measure you used. If you measured temperatures or effective clocks, note the sampling interval and the start and end of the comparison.
For example, a result can state that the same scene stayed near a 7 ms frame interval at both scales while GPU Busy fell, with the cap disabled and the same slow area recurring. Those numbers illustrate the format. Confirm the actual CPU-side cause with a thread, scene, or setting check before making a purchase decision.
Save the captures when the symptom is intermittent. A future game or driver update can change what part of the pipeline is most demanding. The same route and measurement setup make it easier to see whether a fix or upgrade improved the experience you care about.
Read three possible outcomes from the same test
Imagine a hypothetical capture where the normal render scale produces a 6 ms frame interval and about 5.5 ms of GPU Busy. At a lower render scale, the interval moves to about 4.8 ms while GPU Busy drops. That result supports a meaningful GPU constraint at the original settings.
A second scene can show a different pattern. Suppose frame intervals stay close to 7 ms while GPU Busy falls markedly after lowering the render scale.
With caps and synchronization effects ruled out, spending further time on graphics resolution has little evidence of helping that area. An engine, CPU, or data-supply check is more useful.
Now suppose both runs sit almost exactly at 8.33 ms and the game has a 120 FPS limiter. The consistent frame rate is expected while the cap is active. Retest without that cap if the diagnosis requires knowing which component would limit an uncapped run.
These are illustrative numbers, not performance targets. Focus on how each measurement changes when the test variable changes. If the reference scene changes too, even precise measurements can lead to the wrong conclusion.
Check whether the slowdown follows the process or the whole PC
- What to do Capture the original game scene and observe whether other work starts at the same time. Repeat the scene with optional screen recording or background jobs paused.
- Expected result A scene-dependent CPU constraint remains visible even without unrelated background work, or the slowdown disappears when the competing job is absent.
- If the check fails If the problem is intermittent, note the timestamp and compare a second run at the same settings. Look for a matching update, recording task, or storage event.
A CPU spike from background work can reduce the time available for a game thread. An external encoding task can also use GPU or storage resources depending on its settings. Treat those as controlled variables when you need to understand the machine’s actual gaming configuration.
If you normally play while streaming, create two baselines. One should represent gameplay alone and the other your usual streaming settings. The second result can be the more relevant one for a purchase or tuning decision, but it answers a different question.
Watch for constraints that last just one part of the workload. A stream configuration can affect the slowest frames even if average FPS changes little. Compare captures covering the same scene and similar activity on the PC.
A test also benefits from recording the frame metric you selected. Presented frame intervals, display timing, and in-game FPS counters may not describe the same thing. Compare like with like, especially when frame generation, variable refresh, or an external limiter is available on the system.
If the lower-scale run shows no change, look for a render-scale setting that actually affects internal resolution. Some games apply settings only after a restart or keep a dynamic scale in effect. Confirm the new values before assuming you have already removed a significant amount of GPU work.
A useful follow-up is to restore the original resolution and repeat the baseline after the lowered test. If the original result also changed, the workload, background activity, or starting conditions were probably different. An A/B/A sequence helps expose drifting game behavior, a warmer case, or a scene that was less reproducible than expected.
Keep that repeatability check focused on the specific issue. One long benchmark can obscure a short but important section where the CPU-side constraint appears. Crop captures to the same section and compare the distribution of frame intervals there.
Conclusion
Lower render resolution in the same uncapped game scene and compare frame times against the drop in GPU work. If performance barely changes, check CPU thread behavior, clocks, and limits, then rule out caps, streaming, and memory pressure. Confirm the result in the specific scenes and frame-rate target that matter to you.