🛒 Best Price Today on Amazon
Prime members get fast, free shipping on everything above, plus member-only deals. New members get a 30-day free trial — cancel anytime.
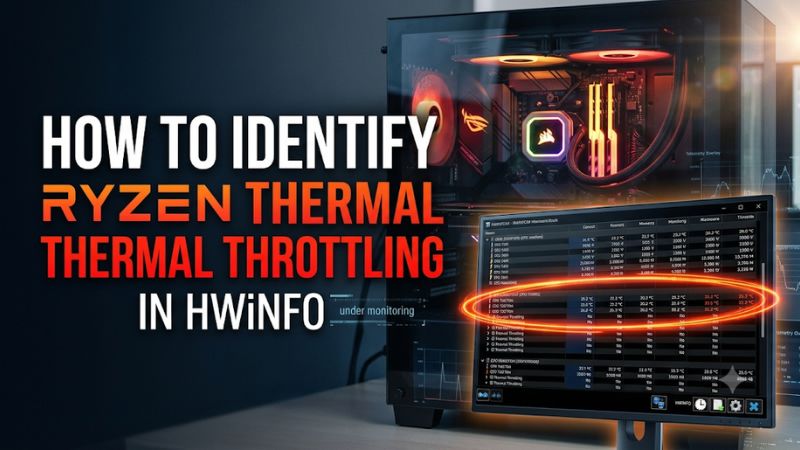
Open HWiNFO in Sensors-only mode, reset its statistics, and log a repeatable workload. To learn how to identify Ryzen thermal throttling in HWiNFO, line up CPU temperature, throttle flags, effective clocks, and performance at the same time. Check your exact Ryzen model’s temperature limit before deciding what the readings mean.
Which HWiNFO sensors show Ryzen thermal throttling?
Start in the enhanced sensor group for your Ryzen processor. Look for a direct thermal-throttling flag and record it next to temperature and effective clocks. HWiNFO exposes different fields depending on the Ryzen model, firmware, and application version.
Find Temperature, Thermal Limit, and Throttling rows
- What to do Expand the CPU’s sensor group. Look for CPU (Tctl/Tdie), Core Effective Clocks, CPU Package Power, and any rows labeled Thermal Throttling, HTC, PROCHOT CPU, PROCHOT EXT, or Thermal Limit.
- Expected result You can match a temperature in degrees Celsius with clock data and the thermal status exposed for that processor.
- If the check fails Update to a HWiNFO release that supports the platform and check for collapsed or hidden rows. Use a timestamped temperature and clock comparison if a direct flag is absent.
The field CPU (Tctl/Tdie) is a useful place to start. A separate CPU Die (average), chiplet temperature, or motherboard socket reading can describe a different part of the system. Use the same temperature row for each run.
Check the unit beside any Thermal Limit reading. A percentage indicates proximity to a limit, while a temperature reading is in degrees. A thermal limit percentage can be useful when you want to see which constraint the CPU approached, especially if firmware has set a lower threshold for the operating profile.
Read Current and Maximum separately
- What to do Reset HWiNFO statistics just before your test. Compare Current during the slowdown and Maximum after it.
- Expected result Current shows whether a flag is active at the latest sample. Maximum indicates whether HWiNFO saw the flag become active during the measured interval.
- If the check fails If only Maximum reads Yes, record another run to CSV. Use the timestamped rows to see whether the flag occurred at the time of the slowdown.
A Yes in Maximum can stay visible after the system has recovered. It can also come from an unrelated event earlier in a long session if you started monitoring before the test. A new log and a reset make the event easier to interpret.
A normal-looking Maximum temperature can coexist with a brief flag. Polling samples the sensors at intervals, so a fast change or a separate platform signal may appear without a matching temperature maximum. Check reproducibility before deciding that a temperature reading or flag is faulty.
Match the flag to its likely source
HTC is a hardware thermal control indicator where exposed. PROCHOT CPU and PROCHOT EXT labels vary by platform and software support. The external signal can point to a component or a platform controller asking the CPU to slow down.
| Reading | What it tells you | Best next check |
|---|---|---|
| Thermal Throttling or HTC changes to Yes | The CPU reported a thermal control event in that run | Align it with CPU temperature, clocks, and work rate |
| PROCHOT EXT changes to Yes | An external or platform source may request throttling | Check the board, power, cooling, and OEM sensors |
| Thermal Limit approaches 100% | The processor is near an exposed temperature constraint | Check the reported unit and exact model limit |
| CPU Package Power or PPT reaches a plateau | A power or current constraint may be active | Check PPT, TDC, EDC, and thermal flags together |
| Reported clock drops during a lull | The workload or core residency may have changed | Compare CPU use and effective clocks during active work |
If external and internal flags turn on together, the combination still needs context. One sample cannot identify the exact component that initiated a platform-wide response. Record temperature and power behavior before asking the board or laptop vendor to interpret a persistent event.
How do you capture an event without mixing it with idle?
Pick a workload you can repeat and observe. If a particular game route, render, or build consistently triggers the issue, use that workload before introducing a separate benchmark.
Set up the log before you start
- What to do Start HWiNFO sensor logging, note the time the workload begins, and use a polling interval that gives useful detail without disrupting the test.
- Expected result Your file contains timestamped temperatures, effective clocks, power readings, and any exported thermal flags on both sides of the event.
- If the check fails Run a short export check. Verify that the desired columns are enabled and that you can match the spreadsheet’s time and units to the live readings.
An interval around one second can be a practical starting point for a sustained event. Use the same interval across runs. Shorter intervals increase detail but can add monitoring overhead, and even a fast polling setting can miss a very brief transition.
Note whether a game started with a warm CPU, cold coolant, or a graphics workload already running in the background. For a sustained test, use the same room conditions as closely as practical. Large changes in ambient temperature can change how much cooling headroom is available during a run.
Compare the beginning, slowdown, and recovery
Record the first stable period under load, the point where the CPU slows, and the period after the load ends. If you can reproduce the issue in a game, use an FPS or frame-time log and align it with HWiNFO’s timestamps. A performance counter is helpful when you want to separate a thermal event from a change in graphics settings or scene.
- What to do Write down the time of any sustained stutter or drop in throughput and locate that same window in the sensor log.
- Expected result A thermal episode has a consistent sequence. The active signal and a temperature constraint appear near a sustained effective-clock or performance decrease under comparable work.
- If the check fails Compare the neighboring rows and repeat the same scene. A single out-of-context value rarely identifies the cause of a long slowdown.
A task may slow near the end because the work itself changed. Compare like-for-like sections of a render or the same repeating benchmark loop. Watch the active cores if only a few threads matter, since the average of all cores can fall while the important game thread continues running at its usual speed.
Use effective clocks to evaluate actual work
Instantaneous core clock readings are useful, but they can represent a requested or sampled frequency while a core spends time asleep. Effective Clock helps show activity across the polling interval. A lower effective clock at idle is expected on a core doing little work.
For diagnosis, look at the same active cores and comparable CPU usage before and during the slowdown. If utilization fell first, a game cap or workload change may explain the lower frequency. If demand remained high while thermal flags appeared and effective clocks fell, the thermal explanation is stronger.
For an all-core workload, compare the average effective clock across the loaded cores and the time to finish the same job. For a lightly threaded game, examine the main work interval and correlate the frame-time changes. Using both approaches prevents a normal sleeping core from being mistaken for evidence of a failing cooler.
How do you distinguish heat from power limits and normal boost?
Compare the CPU temperature to the published maximum operating temperature for the exact model. Also check the current limits in firmware or an active laptop power mode when those are visible. A single cutoff such as 90°C does not apply to every Ryzen.
Check the exact processor and its active temperature target
AMD lists 89°C as maximum operating temperature for the desktop Ryzen 7 7800X3D and 95°C for the desktop Ryzen 9 7950X. Those examples illustrate why a temperature that looks acceptable for one chip could be near the ceiling for another. Use your exact product name, including an X3D or mobile suffix.
A cooling or power profile can impose a lower target. On compact and laptop systems, platform temperature limits and fan policy may matter even when the CPU’s advertised maximum is higher. Compare runs under the same profile and power-source conditions.
- What to do Check the maximum temperature specification and note any lower firmware or OEM profile target you can verify.
- Expected result Temperatures and Thermal Limit readings fall into a range that makes sense for your exact model and setup.
- If the check fails Identify the CPU and system suffix in Windows or firmware, then look for the specification for that exact device.
Separate boost adjusting to temperature from a reported slowdown
Precision Boost changes frequency according to the workload and available thermal, power, and electrical headroom. Under sustained work, a CPU can settle at a lower frequency than its short-duration peak. Clock changes during warm-up are part of normal operation, and the effect on performance can vary.
A hard or repeated thermal event is easier to establish when a flag is active and clocks or throughput fall during a comparable task. A CPU consistently near its temperature target can also be thermally constrained even if no separate flag is exported. In that case, compare results after a safe, reversible improvement in cooling while holding the workload and power profile constant.
For example, if a representative render runs faster with a supported, more active fan profile and comparable power settings, temperature headroom was likely relevant. If throughput barely changes and the power-limit reading stays high, power may dominate this workload. Treat one data point as a lead, and confirm it with another controlled run.
Check PPT, TDC, and EDC before blaming the cooler
PPT refers to a processor socket power limit. TDC and EDC describe sustained and peak current limits in AMD’s tuning framework. Where HWiNFO exposes percentages or limit values, read their units and compare them with the thermal data.
- What to do Inspect power and current limits during the same timed window as the suspected throttle event.
- Expected result A power-limited run can press against an electrical limit while the thermal flags remain clear and temperature stays below its active target.
- If the check fails If several limits are approached together, change only one reversible condition, such as supported fan speed, and retest the same workload.
An Eco Mode profile or a manufacturer’s quiet mode can intentionally reduce performance under heavy loads. Record the profile before comparing temperatures against another machine. Similarly, a game that hits a frame cap can have lower CPU package power and effective clocks because the system is waiting between frames.
What should you check after confirming a thermal event?
Start with observations you can verify without changing protection settings. Identify whether the temperature issue is local to the CPU, tied to the case or cooler, or associated with another component.
Verify cooler operation and airflow
- What to do Check heatsink or radiator fans, airflow direction, and pump RPM where available. Inspect accessible dust filters and vents while the computer is off.
- Expected result The fan speed responds when temperature rises, the heat exchanger has a clear air path, and cooling recovers when the workload ends.
- If the check fails Stop a run if temperatures climb rapidly, a pump appears stopped, or the system repeatedly shuts down. Inspect the cooling setup before running another sustained workload.
If the problem began after a cooler change, check mounting pressure, the protective film, and the correct CPU socket hardware with the system powered down. A pump or fan reading alone does not prove heat is moving through the cooler. For liquid cooling, a fan curve tied to coolant may also respond more slowly than a CPU-temperature curve.
Profiles matter on laptops and small desktop systems. Confirm that the machine is on a hard surface with clear inlets, that it uses the supported charger if applicable, and that the fan mode is the one you intend to test. Compare the same workload again after restoring normal airflow.
Investigate an external flag while CPU temperature is modest
Separate a repeated external signal from a high CPU die temperature. Check the motherboard or system’s available power, VRM, and other thermal readings. On a laptop, the embedded controller and shared cooling can also influence what the CPU is allowed to do.
- What to do Record external and CPU-side flags with CPU and GPU temperatures and the current charger or power profile.
- Expected result The event either follows a repeatable CPU temperature pattern or points to a separate platform condition.
- If the check fails If the probe shows no clear temperature explanation, send a timestamped log and system information to the board or laptop manufacturer for interpretation.
An external signal and immediate clock drops while CPU temperature is well below its target can justify looking beyond the CPU cooler. Pay attention to whether the issue appears only during simultaneous CPU and GPU work, after the power adapter changes, or with an enclosure closed. Keep hardware protections enabled throughout the diagnosis.
Verify the repair against the same workload
Start from roughly the same thermal state and repeat the same route or workload. Reset sensor history and use the same polling interval. Compare the time of the original event, the number of recurring active samples, and the measured performance.
- What to do Save one log before and one after the change. Record the CPU model, firmware version, room conditions, and workload settings.
- Expected result The original slowdown and thermal signal occur less often or disappear under comparable demand, with stable power and clocks.
- If the check fails Undo ineffective changes and isolate the next likely cause. Give support the smallest repeatable example rather than stacking several changes in one run.
A repeat test is particularly valuable when the only evidence was a Yes in Maximum. A clean run confirms whether the indication is repeatable and whether the performance symptom changed. If high temperature persists but the expected performance is stable and the CPU behaves within the manufacturer’s operating guidance, the trace can represent normal heat management for that workload.
Interpret a sequence of readings instead of a single spike
Consider a hypothetical 7950X running the same render loop for several minutes. Early in the loop, the loaded cores deliver steady work and the thermal status stays clear. Later, temperature approaches the configured target, a thermal flag becomes active, and completion time per loop increases.
That sequence makes temperature relevant because the performance drop occurs when the thermal behavior changes under a comparable workload. If the first loop was compiling assets and the second was actually rendering, the comparison would be weaker. The material being processed must stay comparable during the interval you examine.
Now consider another run that shows one Yes in Maximum but keeps stable clocks, throughput, and temperatures throughout the recorded segment. Treat that as a prior or short event until the timestamped data proves otherwise. Performance in the rest of the capture does not automatically belong to that one flag.
A different pattern is modest CPU temperature and an external flag during simultaneous graphics and CPU work. In that case, record GPU temperature, board or laptop model, and power settings. A repeatable external event while CPU temperature remains well below its usual target warrants platform investigation before you replace the CPU cooler.
Compare a warm run with one reversible cooling change
Pick a reversible action that addresses the observed condition. For example, use a documented higher fan mode or clear a blocked intake with the machine powered off. Then start again from a similar thermal state, using the same task and power profile.
- What to do Compare a baseline run with one safe cooling change, and note whether the active flag, sustained temperature, and completion time change together.
- Expected result Better cooling headroom delays or reduces a reproducible thermal event when heat is limiting that workload.
- If the check fails Check whether you changed several conditions at once, whether the workload stayed comparable, and whether a power, clock, or external limit is now controlling the result.
On an AIO system, the first run can begin with colder liquid than a second run started right after it. Allow the temperature to return toward the same baseline or compare equivalent steady sections.
A warm start is useful if it reproduces the original complaint. Use it consistently across runs.
Consider what counts as success before you test. A small peak temperature change may be irrelevant if the CPU never lost performance. If the task completes faster, verify that the comparison did not accidentally use a different output, application preset, or benchmark loop.
Make a short summary that links the flag to the workload and action. Include when the event began, which readings were active, what changed, and whether performance recovered. The summary helps you or a support technician reproduce the symptom without searching through the entire log for one value.
Remember how HWiNFO groups the readings in your saved log. Package power may appear alongside core temperatures, platform sensors may appear under the board, and the GPU usually has a separate group. Write down the full sensor name and its group if another person will analyze the capture.
If you share a short extract, include a few samples before the event and after performance returns. That context makes it possible to see whether the throttle flag led or followed the clock change. The beginning and end of a single captured peak are easy to misread when the surrounding readings are omitted.
Conclusion
Reset HWiNFO before a representative workload and correlate Ryzen throttle flags with CPU temperature, effective clocks, and actual performance. Use the exact CPU temperature limit to interpret the readings, and investigate external flags or electrical limits separately. Repeat the same run after fixing a cooling or platform issue so you can verify the change.