🛒 Best Price Today on Amazon
Prime members get fast, free shipping on everything above, plus member-only deals. New members get a 30-day free trial — cancel anytime.
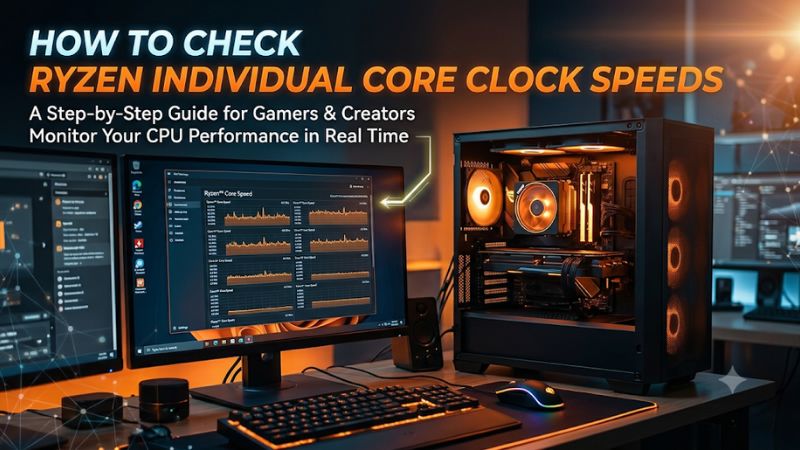
Here’s how to check Ryzen individual core clock speeds using HWiNFO Sensors or AMD Ryzen Master. Use effective clocks to see what each core does across a sampling interval. Run a single-thread test for boost behavior and a multi-thread test for sustained clocks. Save the readings alongside the workload.
Open a monitor that shows individual cores
Use HWiNFO Sensors to see per-core clocks
Start HWiNFO in Sensors-only mode. In the Sensors window, find the group for your AMD CPU and expand the clock entries. Names vary slightly by CPU generation and utility version, but look for individual Core Clock and Core Effective Clock rows. On some configurations, effective readings are listed by core and thread. Start with the rows for the individual cores or threads rather than the aggregate average.
Use the sensor columns deliberately:
| Column | What it tells you | Best use |
|---|---|---|
| Current | The value from the latest reported sample | Match an active core to an ongoing task |
| Minimum | The lowest logged value since reset | Check idle behavior or spot a drop that needs context |
| Maximum | The highest logged value since reset | Check whether a core reached a short boost |
| Average | The average recorded by the utility since reset | Compare identical test windows |
| CSV log | A sample-by-sample record when logging is enabled | Compare clock changes with temperature, power, and workload timing |
Reset the minimum, maximum, and average before each trial. Otherwise, a momentary boost during application launch can become the maximum for your later gaming run. Start logging shortly before the workload starts, mark when the useful part begins, and stop shortly after it ends. Compare the same segment across runs.
If you see an average effective clock for the whole CPU, keep it separate from the individual values. A single-thread workload can keep one core busy while most remain nearly asleep. A low CPU-wide average fits that scenario even when the working core boosts strongly. Expand the underlying rows before judging individual behavior.
Use AMD Ryzen Master for a per-core overview
AMD Ryzen Master provides per-core monitoring on supported systems. Open the monitoring view and use the available core display rather than the single overall peak clock. The application interface can vary with the CPU and installed version. If the display groups cores by CCD, open the relevant group and watch how activity moves between cores.
Keep tuning controls separate from measurement. Leave profiles, voltage, and boost settings alone for your first run. Record your baseline before changing anything. This is especially helpful if the machine already uses a motherboard enhancement, Eco Mode, Precision Boost Overdrive, or a custom curve. Capture the current state so the comparison can be repeated.
Ryzen Master can also help you identify preferred cores where that feature is shown. Treat a preferred core as a useful observation about scheduling and boost potential. A game or benchmark can still migrate work. Observe the active core during the run and compare what you see in a second pass. Older tool versions or unsupported mobile systems may offer limited data, so use a supported hardware monitor if Ryzen Master cannot display the information you need.
Before collecting a formal log, close other monitoring utilities and overlays you do not need. Each tool samples the system on its own schedule. Simultaneous updates can make two correct readings appear inconsistent and may add background activity during an idle test. Choose one utility as the reference for repeated measurements.
Distinguish cores, SMT threads, and CCDs
A physical core is a hardware execution resource. When simultaneous multithreading is enabled on a typical Ryzen CPU, that core can present two logical processors to the operating system. A monitor may show entries such as Core 3 T0 and Core 3 T1. These are sibling threads of one physical core. Each thread’s activity can differ even though both share core resources.
Avoid adding the two thread-level clock figures to calculate a physical core’s speed. Instead, record the thread activity or compare the same row across tests. If one thread row is active and its sibling is mostly idle, that is an expected outcome for a single-thread task. Compare the application’s thread count, the operating system’s logical CPU layout, and the monitor’s row names before assigning a clock figure to a physical core.
A multi-CCD Ryzen adds another layer. One CCD can contain the cores doing most of the work while another sits comparatively quiet. Some X3D models also have different cache arrangements across chiplets. For a workload comparison, identify the active CCD and note where the work ran. You can get a meaningful reading without assuming every core or chiplet should be equally busy.
Read instantaneous clocks, effective clocks, and boost
Understand what the two clock measurements represent
A Core Clock value describes the frequency reported or inferred at the moment the tool sampled the core. Core Effective Clock accounts for the clock cycles observed over the sampling interval, including time when the relevant core or thread was inactive. The difference is especially visible at idle and when tasks arrive in short bursts.
For example, imagine a core runs at about 5,000 MHz while active for half of a one-second interval and spends the remaining half in a sleep state. A simplified effective result is about 2,500 MHz across that interval. The actual tool uses hardware counters and the processor’s real activity, which can change many times during a sample. The example explains why a high instantaneous snapshot can coexist with a much lower effective value.
Match the metric to the question:
- Did a core touch a high frequency during light work? Look at the relevant Core Clock maximum within a clean test window.
- How much active clock behavior did the core sustain while rendering? Look at effective clock during the loaded segment.
- Was a low value caused by sleep or by poor sustained performance? Check utilization and the workload result over the same interval.
- Did a tuning change actually improve throughput? Compare the benchmark result and effective clocks across repeated runs.
A larger gap at the desktop is ordinary when cores go to sleep. A sustained gap on a core that is consistently busy deserves more context. Check for work moving between threads, changing workload intensity, added limits, and differences in polling before drawing a conclusion.
Compare max boost with the right kind of workload
AMD defines maximum boost as the highest frequency a single core can achieve on a suitable bursty single-threaded workload, with actual results dependent on factors such as cooling, motherboard firmware, workload, and power conditions. A published boost figure is relevant to short opportunities on one core. Sustained all-core speeds belong to a different workload.
A multi-thread render engages far more of the chip at once. Power and current demand rise, and the processor can settle at lower clocks while completing more total work. If a single-thread benchmark reaches a higher figure than an all-core render, that is consistent with how Precision Boost allocates headroom. Compare each test against its own baseline and against benchmarks with similar power settings.
Base frequency is a published specification rather than a minimum number that every core must report at idle. Idle effective readings can fall well below it. Conversely, an instantaneous clock well above base does not establish that every core did useful work at that rate for the entire interval. For problem solving, pair frequency with utilization, temperature, and actual performance.
Set a sample interval that matches the job
A one-second interval is a practical starting point for observing a steady render or for building an uncomplicated game log. Shorter intervals can reveal more rapid changes and increase logging overhead. Longer intervals can smooth bursts into one average. Keep the interval consistent when comparing tests.
As an example, a boost lasting a small fraction of a second can be missed by the instantaneous sample. Increasing polling frequency improves your chances of seeing brief activity, but a sampled maximum is still a sample. If several benchmark runs show normal scores and the relevant effective clocks behave as expected, a missing short peak in one log carries little weight by itself.
For a game, use a stable interval and record frame times with a tool intended for frame analysis if you need to diagnose stutter. A frequency sample every second cannot show the exact sequence of frames within that second. Use it to establish the broader conditions when the problem occurred. Pair it with a frame-time trace to see whether visible spikes coincide with power, temperature, or workload transitions.
Run a single-thread test and a multi-thread test
Measure light-load boost with a repeatable single-thread run
Close unrelated foreground work, start the sensor display, and reset the statistics. Run a benchmark with an explicit single-core or single-thread mode. Keep it active long enough to show a pattern, then record the benchmark score and the clock statistics for the relevant cores.
Use this sequence:
- Note your CPU model, firmware profile, and the test name.
- Reset the sensor stats and start logging if needed.
- Run the same single-thread test from start to finish.
- Check which core or cores had sustained activity.
- Compare instantaneous peaks and effective clocks inside the loaded interval.
- Repeat once using the same application and settings.
A task can move between preferred cores during the test. A maximum on Core 2 in one run and Core 5 in another does not necessarily identify a fault. Compare the combined evidence from score, utilization, temperature, and active-core effective clocks. If the utility shows high maximums on several cores, the values can have occurred at different moments.
For an advanced comparison, process affinity can sometimes help keep a suitable benchmark on one logical processor. Begin without pinning so you can see ordinary scheduler behavior. If you later use affinity, identify which logical processors share each physical core and keep the benchmark, power settings, and polling the same. A pinned result answers a different question from default scheduling and should be labeled accordingly.
Measure sustained clocks in a multi-thread workload
After the first test, stop the log, reset it, and begin a separate run of a repeatable CPU-intensive application. Use a multi-thread renderer or another known workload that engages the intended cores. Allow it to run long enough for clocks and temperature to settle before you judge the results.
Read temperature and CPU package power alongside the clock rows. Where the monitoring tool exposes them, note whether thermal or power limits were approached. Use the benchmark’s total work, elapsed time, or score as the performance measure. Frequency alone gives an incomplete account of what the processor achieved.
A plausible pattern is a high clock in the first seconds, followed by slightly lower stable clocks as the cooler warms and sustained power behavior settles. Compare the whole interval instead of selecting the highest first sample. If one group of cores stays much quieter throughout, check whether the software is using the expected number of worker threads. A renderer with a thread limit can produce a clean log with unused cores.
If two runs behave differently after a setting change, restore the original setting and repeat the baseline. A reproducible difference is more informative when the same workload, duration, background tasks, and cooling conditions were used. Let the system return to a similar starting temperature before making a close comparison.
Check per-core behavior while gaming
A game adds changing workload, frame caps, and background activity. Pick a repeatable location or built-in benchmark. Use the same graphics settings, resolution, and scenario for several runs. Log the individual core effective clocks, CPU temperature, CPU and GPU utilization, and package power if available.
Look for a pattern rather than a single reading. One busy core or a few busy cores can coexist with modest total CPU utilization. In a GPU-limited scene, the CPU may spend part of each interval waiting for the next opportunity to submit work. A frame cap or V-Sync can also reduce apparent demand. Pair the log with an average frame rate and a frame-time trace before deciding whether low clocks are a problem.
Compare at least one CPU-heavy scene and one representative normal scene. For a multiplayer game, use a replay or controlled route where possible because player actions and server behavior introduce variation. If a low-clock interval only appears when the game enters a menu or applies a frame cap, it is likely describing a change in demand. A low-clock interval that aligns with a repeatable drop in benchmark performance is worth testing separately.
Troubleshoot readings that look wrong
Check the workload before changing boost settings
If every core looks slow, confirm that the application is actually doing work. A loading screen, paused benchmark, game cap, or GPU limit can leave headroom and lower effective clocks. Check which process is active and how long the CPU stays busy. Then compare measured performance against the same benchmark on your own system.
If the workload is sustained and the score dropped materially, look for a change in thermal limits, power limits, firmware, or a background task. Check whether the system has moved to an efficiency profile or whether a configured limit changed. Also consider laptop power states if you are on a supported mobile device. A machine on battery can have a different performance target than the same one plugged in.
Keep a known-good baseline before experimenting with PBO or Curve Optimizer. If a tune shows higher reported snapshots but worse benchmark scores, restore the prior settings and compare effective clocks and throughput under the same load. The difference between Core Clock and Effective Clock can help flag a condition to investigate, but that gap alone does not establish one specific tuning fault.
Check missing rows or disagreements between utilities
Start by verifying the processor name and the current monitor version. Some rows are hidden when a group is collapsed. A mobile or OEM model may expose a different set of telemetry. If you see only a single overall CPU speed in a general operating-system screen, open a per-core monitor rather than treating the aggregate as each core’s speed.
When two utilities disagree, compare the metric and the sampling interval. Peak speed may refer to any core, while an effective reading may represent one core or thread. One utility can retain a maximum since launch while the other shows the most recent sample. Clear both sets of statistics, observe one workload window, and compare like with like.
If the OS reports fewer logical processors than expected, verify the exact CPU model, SMT status, and whether the system is virtualized or configured with processor limits. If a core stays quiet, verify that the workload uses enough threads before assuming a physical core is absent. A count from the operating system describes what it sees in the current configuration.
Save a reusable record of your baseline
A useful report includes the CPU model, BIOS settings, tool and interval, workload, and test time. For each test, save the score or completed work, the active-core effective readings, the peak clocks, and the CPU temperature. For gaming, add frame times and note any frame cap. That information makes it possible to compare driver, firmware, cooling, or power-profile changes later.
You can also save a simple set of reference results: one short idle observation, one single-thread run, one sustained multi-thread run, and one repeatable game segment. Each answers a different question. The idle result shows how quickly cores settle. The single-thread result shows burst behavior. The render shows sustained activity. The game shows how the processor behaves in the specific use case you built the PC for.
Conclusion
Use HWiNFO Sensors or AMD Ryzen Master to view the individual Ryzen cores. Read instantaneous clocks for sampled frequency peaks and effective clocks for activity across a time window. Reset the stats before each test, identify which cores were busy, and compare the readings with the workload’s actual result. Separate single-thread boost, sustained all-core work, and gaming before deciding whether a core is performing as expected.