🛒 Best Price Today on Amazon
Prime members get fast, free shipping on everything above, plus member-only deals. New members get a 30-day free trial — cancel anytime.
- Best GPU and CPU Benchmark Software Compared
- 3DMark – Best Overall GPU Benchmark for Gaming PCs
- Cinebench – Best for CPU Rendering Performance
- Geekbench 6 – Best for Quick Cross-Platform Comparisons
- OCCT – Best for CPU and GPU Stability Testing
- PassMark PerformanceTest – Best Full-System Benchmark Suite
- How to Choose GPU and CPU Benchmark Software
- How to Get Reliable Benchmark Results
- FAQ
- Conclusion
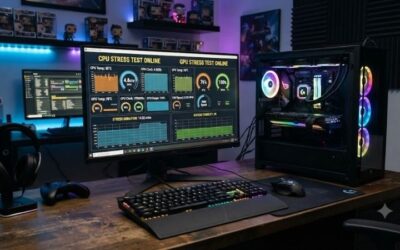
The best GPU and CPU benchmark software should measure performance consistently, expose thermal or stability problems, and make hardware comparisons easy to understand. 3DMark is excellent for gaming GPUs, Cinebench suits CPU rendering tests, Geekbench simplifies cross-platform comparisons, OCCT targets stability, and PassMark tests the entire PC.
Quick answer: For most people in 2026, the best gpu and cpu benchmark software is the Software — our #1 rated choice. See the full ranked comparison, alternatives and buying advice below.
Best GPU and CPU Benchmark Software Compared
| Software | Best For | CPU Testing | GPU Testing | Stress Testing |
|---|---|---|---|---|
| 3DMark | Gaming GPU performance | Yes | Excellent | Yes |
| Cinebench | CPU rendering performance | Excellent | Yes | Limited |
| Geekbench 6 | Quick CPU/GPU comparisons | Excellent | Compute | No |
| OCCT | Stability and overclock testing | Excellent | Excellent | Excellent |
| PassMark PerformanceTest | Full-system benchmarking | Excellent | Excellent | Limited |
Benchmark software serves different purposes, so one score cannot describe every aspect of a PC. A gaming GPU benchmark may tell you how well a graphics card handles demanding rendering workloads, while a CPU benchmark may focus on compression, physics, rendering, or single-thread responsiveness.
For meaningful testing, use several tools instead of relying on one synthetic number. A good gaming-PC workflow might combine 3DMark for graphics performance, Cinebench or Geekbench for CPU comparisons, and OCCT for stability testing after changing cooling, memory settings, undervolting, or overclocking.
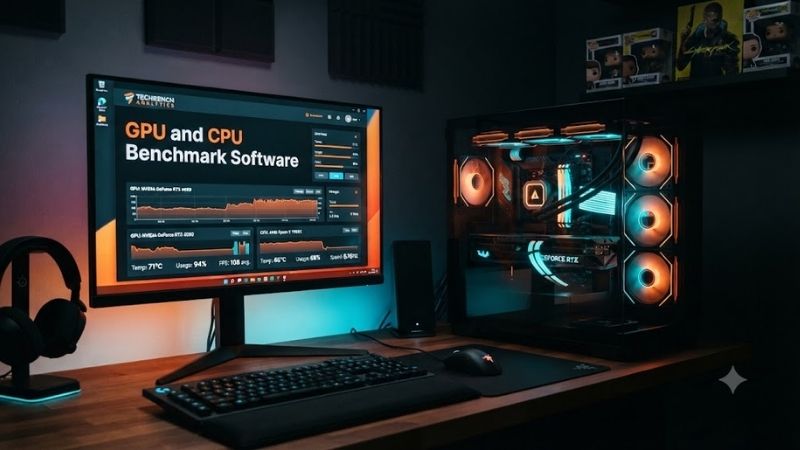
3DMark – Best Overall GPU Benchmark for Gaming PCs
Best For: Gamers comparing graphics cards, testing upgrades, or validating GPU performance
3DMark is one of the most useful benchmark suites for gaming-oriented graphics hardware because it contains tests targeted at different GPU classes and rendering technologies. Current tests include Steel Nomad, Speed Way, Steel Nomad Light, Solar Bay, CPU Profile, and several dedicated graphics feature tests.
UL recommends Steel Nomad for powerful modern gaming PCs using rasterized graphics and Speed Way for mid-range to high-end ray-tracing-capable GPUs. Steel Nomad renders at 3840 × 2160 and intentionally uses a demanding non-ray-traced gaming workload, making it particularly useful for comparing current discrete graphics cards.
Key Features
- Steel Nomad GPU benchmark
- Speed Way ray-tracing benchmark
- CPU Profile benchmark
- Stress-test modes
- DirectX 12 testing
- Vulkan support on selected tests
- Ray-tracing feature tests
- DLSS, FSR, and XeSS tests
- Storage benchmark
- Online score comparison
What Makes It Different
3DMark is built specifically around graphics workloads that resemble gaming technology rather than generic compute alone. Speed Way includes rasterization, compute, and ray-tracing passes, while Steel Nomad focuses on demanding rasterized graphics. This makes its results easier to relate to gaming hardware than many productivity-oriented benchmarks.
The suite also provides separate feature tests instead of forcing every technology into one total score. You can investigate ray tracing, PCI Express bandwidth, mesh shaders, variable-rate shading, NVIDIA DLSS, AMD FSR, or Intel XeSS individually when troubleshooting or comparing specific GPU capabilities.
Pros
- Excellent for gaming GPUs
- Multiple modern graphics workloads
- Separate CPU benchmark
- Useful online comparisons
- Stress testing available
- Suitable for hardware reviews
- Supports several graphics APIs
Cons
- Full suite can be overwhelming
- Synthetic scores are not actual game FPS
- Some tests target specific hardware classes
- Not primarily designed for CPU productivity analysis
Use Case
Use 3DMark after installing a new graphics card to verify whether the score is close to comparable systems. If performance is unexpectedly low, check temperatures, clock speeds, PCIe configuration, power limits, driver installation, and background processes before assuming the GPU itself is defective.
Stress tests are useful after overclocking or undervolting because they repeat graphics workloads long enough to reveal heat-related instability. UL specifically recommends extended stress testing on thermally constrained systems to examine how heat buildup affects sustained performance rather than relying only on one short benchmark run.
Who It’s For
3DMark is the strongest option in this roundup for gaming-PC enthusiasts, reviewers, overclockers, and anyone comparing GPUs. It should not completely replace real-game benchmarks, but it provides a controlled baseline that makes before-and-after hardware or configuration testing much easier.
Cinebench – Best for CPU Rendering Performance
Best For: Evaluating single-core and multi-core processor performance
Cinebench is widely used to evaluate CPU performance through rendering workloads. Unlike a gaming benchmark, it focuses on a computationally demanding content-creation task, making it useful for comparing processors, cooling systems, power limits, and performance changes after BIOS tuning.
The modern Cinebench generation also expands beyond the CPU-only role associated with older versions by providing GPU rendering evaluation on supported hardware. For PC builders, however, its most familiar role remains CPU testing because a repeatable rendering workload quickly exposes how well a processor sustains clocks under heavy load.
Key Features
- Multi-core CPU benchmark
- Single-core CPU testing
- Rendering-based workload
- GPU rendering support on compatible hardware
- Easy score comparison
- Useful for thermal testing
- Straightforward interface
- Good for before-and-after tuning
What Makes It Different
Cinebench focuses on a workload that can use many processor cores effectively. That makes it especially informative when comparing CPUs for rendering, content creation, and other heavily threaded applications. A 16-core CPU can therefore show a much larger advantage here than it might in a lightly threaded game.
The single-core result is useful for understanding performance when applications cannot fully use every core. However, neither single-core nor multi-core Cinebench results should be treated as direct gaming FPS predictions because game engines depend on different instruction mixes, cache behavior, memory latency, and GPU interaction.
Pros
- Easy CPU benchmarking
- Single-core and multi-core results
- Heavy sustained processor load
- Good for comparing cooling changes
- Useful for workstation CPUs
- Simple scoring system
Cons
- Rendering workload does not represent every application
- Not a replacement for game testing
- Less detailed stability diagnostics than OCCT
- GPU result has a different purpose than gaming benchmarks
Use Case
Cinebench is particularly useful after installing a new CPU cooler or changing processor power limits. Run the same test before and after the modification while monitoring temperature, clock frequency, and power consumption. A better cooling setup may improve sustained performance even if peak clock speed appears unchanged.
Who It’s For
Choose Cinebench if CPU performance is your main concern and you want a simple, repeatable test. It works well for comparing CPUs, validating cooling upgrades, testing workstation performance, or checking whether a processor is behaving similarly to comparable systems.
Geekbench 6 – Best for Quick Cross-Platform Comparisons
Best For: Comparing CPU and GPU compute performance across different systems
Geekbench 6 provides dedicated CPU and GPU benchmark suites using application-style workloads. Its CPU testing includes tasks involving data compression, image processing, and machine learning, while the GPU benchmark measures compute workloads such as image processing, computer vision, computational photography, and machine learning.
This approach makes Geekbench useful when comparing processors across desktops, laptops, and different platforms. It produces clear scores without requiring users to configure many individual workload settings, so it works well when you need a quick performance reference rather than detailed thermal or stability diagnosis.
Key Features
- Single-core CPU score
- Multi-core CPU score
- GPU compute benchmark
- Cross-platform testing
- Image-processing workloads
- Compression workloads
- Machine-learning workloads
- Simple online comparison
- Fast benchmark process
What Makes It Different
Geekbench emphasizes broad application-style workloads rather than a game-like rendered scene. Its CPU suite evaluates both processor and memory performance, while the GPU test focuses on compute performance instead of traditional game rendering. That distinction is important when interpreting results.
A graphics card with a strong Geekbench compute score may still behave differently in games because gaming performance depends on rasterization, ray tracing, drivers, memory bandwidth, CPU interaction, and the specific game engine. Use Geekbench GPU results to compare compute capability, not as a replacement for 3DMark or real games.
Pros
- Fast and easy to run
- Useful cross-platform scores
- CPU single-core testing
- CPU multi-core testing
- GPU compute benchmark
- Straightforward comparisons
- Suitable for laptops and desktops
Cons
- GPU benchmark is compute-focused
- Limited stress-testing functionality
- Less detailed than specialist tuning tools
- Scores do not directly predict gaming FPS
Use Case
Geekbench is useful when comparing two systems that are difficult to test with exactly the same gaming benchmark. For example, it can provide a standardized CPU reference between different laptops, processor generations, or operating systems without requiring long test sessions.
Who It’s For
Choose Geekbench if you want fast, simple comparison data without configuring complex workloads. It is particularly useful for reviewers, laptop buyers, and users comparing CPUs across platforms, while dedicated gamers should pair it with a graphics-focused tool such as 3DMark.
OCCT – Best for CPU and GPU Stability Testing
Best For: Overclockers, undervolters, system builders, and troubleshooting unstable PCs
OCCT is more than a benchmark. It combines CPU, GPU, memory, VRAM, and power testing with extensive monitoring and stability detection. Its current software includes per-core CPU testing, variable GPU workloads, memory testing, and benchmarks designed to measure performance while exposing configuration problems.
The software is especially valuable after changing CPU voltage, GPU voltage curves, RAM timings, power limits, or cooling. A system can complete a short benchmark yet crash after hours of gaming, so stability testing places sustained or targeted load on components to reveal errors that normal benchmark scores may miss.
Key Features
- CPU stress tests
- CPU + RAM test
- GPU stress testing
- VRAM testing
- Power test
- Per-core CPU testing
- Variable GPU loads
- Temperature monitoring
- Voltage and power monitoring
- CPU benchmarks
- Memory latency and bandwidth testing
- Portable operation
What Makes It Different
OCCT’s CPU + RAM test is designed to stress the complete processor and memory chain instead of isolating one component. OCCT describes it as a practical first stability check because the workload can reveal issues across the CPU, memory controller, and RAM rather than producing only a performance score.
Its current releases also continue to receive active stability and compatibility updates. Version 17.1.6 was released on October 1, 2026, with fixes including CPU-sensor handling and Power-test behavior, showing that the software remains actively maintained for current PC hardware.
Pros
- Excellent stability testing
- CPU and GPU workloads
- RAM and VRAM testing
- Detailed monitoring
- Portable executable
- Free personal edition is useful
- Valuable for undervolting
- Good error detection
Cons
- More complex than basic benchmarks
- Heavy stress tests can produce extreme temperatures
- Scores are less gaming-focused than 3DMark
- Beginners need to understand safe temperatures
Use Case
Run OCCT after adjusting an overclock or undervolt. Start with component-specific tests, monitor temperatures and voltages, then test CPU + RAM together. If OCCT reports errors or the system crashes, the settings should not be considered stable even if a game or short benchmark previously appeared fine.
Stress tests intentionally create unusually heavy loads, so thermal monitoring is essential. Stop testing if temperatures exceed safe specifications for your hardware or if cooling behaves abnormally. Stability validation should challenge hardware without ignoring manufacturer operating limits.
Who It’s For
OCCT is the best choice here when the question is not simply “How fast is my PC?” but “Is my PC actually stable?” Overclockers, system builders, repair technicians, and users troubleshooting random crashes can gain more from OCCT than from repeatedly running a traditional score-based benchmark.
PassMark PerformanceTest – Best Full-System Benchmark Suite
Best For: Users who want one application to test CPU, GPU, RAM, storage, and overall PC performance
PassMark PerformanceTest combines several benchmark categories in one program. Its standard suite includes CPU, 2D graphics, 3D graphics, memory, and storage tests, while advanced functions add configurable CPU, GPU compute, drive, memory, physics, networking, and other workloads.
The CPU benchmark uses mathematical and real-world-style operations and supports both single-threaded and multi-threaded scoring. PassMark describes its CPU Mark as a collection of workloads measuring throughput or computations per second, with multi-thread testing using all available threads by default.
Key Features
- CPU Mark
- Single-thread and multi-thread testing
- 3D graphics benchmark
- 2D graphics benchmark
- Memory benchmark
- Disk benchmark
- GPU compute testing
- Overall PassMark Rating
- Large baseline database
- Custom advanced tests
- Portable USB operation
- Windows, macOS, Linux, and mobile versions
What Makes It Different
PerformanceTest is useful because it can identify which component is relatively weak rather than measuring only the CPU or GPU. A system with a powerful graphics card may still show poor storage, memory, or processor results, helping users decide whether their next upgrade should actually be the GPU.
PassMark also maintains a large comparison database built from submitted benchmark results. Users can compare their system with similar hardware and determine whether performance appears normal after a new build, upgrade, BIOS change, or troubleshooting session.
The latest PerformanceTest generation also expands core benchmark categories. PassMark’s Version 12 documentation describes CPU, 2D Web, 3D graphics, memory, disk, and NPU testing where supported, while current public downloads still make the established Version 11.1 build available alongside Version 12 development releases.
Pros
- Tests most major PC components
- Useful baseline database
- CPU and GPU scores
- Memory and storage testing
- Free standard tests
- Advanced configurable workloads
- Helpful for upgrade decisions
Cons
- Overall score can oversimplify performance
- 3D testing is less gaming-focused than 3DMark
- Many test categories can confuse beginners
- Advanced functions may require a paid license
Use Case
PerformanceTest is useful immediately after building or buying a PC. Run the complete suite to create a baseline, then compare individual CPU, GPU, disk, and memory results against similar systems. If one component scores unusually low, investigate that component rather than assuming the entire PC is underperforming.
Who It’s For
Choose PerformanceTest when you want a broad diagnostic benchmark instead of separate programs for every component. It works particularly well for PC builders, repair technicians, used-PC buyers, and users who want to measure whether a hardware upgrade actually improved the system.
How to Choose GPU and CPU Benchmark Software
Use 3DMark for Gaming GPUs
If the main question is how well a graphics card performs in gaming-style workloads, 3DMark should be near the top of the list. Steel Nomad targets demanding rasterized graphics, while Speed Way focuses on modern ray-traced rendering.
Use Cinebench for CPU Rendering
Cinebench works best when you want a straightforward processor workload that can heavily use multiple cores. It is useful for CPU comparisons, cooling tests, and checking whether power-limit adjustments improve or reduce sustained processor performance.
Use Geekbench for Quick Comparisons
Geekbench is ideal when simplicity and cross-platform comparison matter. Its CPU and compute tests use several application-style workloads, making the scores useful as broad references, although they should not be interpreted as direct gaming-performance measurements.
Use OCCT for Stability
If you changed voltages, clocks, RAM timings, or power settings, performance scores are only half the story. OCCT can place sustained and targeted load on CPUs, GPUs, VRAM, and memory while monitoring for errors that indicate unstable settings.
Use PassMark for Whole-PC Testing
PassMark is useful when you want one benchmark suite to identify performance across CPU, GPU, RAM, and storage. Its large baseline database also helps determine whether individual components perform close to other systems using comparable hardware.
How to Get Reliable Benchmark Results
Close unnecessary applications before testing and allow Windows updates, game launchers, and background downloads to finish. Benchmark the PC at a consistent room temperature, keep the same fan profile, and avoid comparing one run performed immediately after startup with another performed after the system has already heated up.
Run important benchmarks more than once. Large score variations can indicate background activity, thermal throttling, unstable settings, or inconsistent boost behavior. Record temperatures, clock speeds, power consumption, and benchmark scores together because a higher score may come from substantially higher heat or power.
FAQ
What Is the Best GPU Benchmark Software?
3DMark is one of the strongest choices for gaming GPUs because it includes current rasterization, ray-tracing, feature, and stress tests. Steel Nomad is recommended for modern rasterized graphics, while Speed Way targets demanding ray-tracing-capable hardware.
What Is the Best CPU Benchmark Software?
Cinebench is useful for rendering performance, Geekbench provides quick single-core and multi-core comparisons, PassMark offers broad CPU testing, and OCCT is better for stability. The best choice depends on whether you care about speed, cross-system comparison, or error-free operation.
Can Benchmark Software Damage a PC?
Normal benchmarking should not damage properly configured hardware, but stress tests can create very high temperatures and power consumption. Monitor temperatures, use adequate cooling, and stop a test if the system exceeds safe operating limits or displays signs of instability.
Is a Higher Benchmark Score Always Better?
A higher score means better performance in that specific benchmark workload. It does not guarantee higher performance in every game or application. Compare scores from the same benchmark version and settings, then confirm meaningful upgrades with the real software or games you actually use.
Should I Benchmark a New Gaming PC?
Yes. Benchmarking a new PC creates a baseline and can reveal incorrect memory settings, thermal throttling, driver problems, power limits, or underperforming hardware. Save the initial results so you can compare them later after upgrades, maintenance, BIOS changes, or cooling modifications.
Conclusion
The best GPU and CPU benchmark software depends on what you need to measure. 3DMark is ideal for gaming graphics, Cinebench handles CPU rendering, Geekbench offers quick comparisons, OCCT excels at stability testing, and PassMark evaluates the complete PC. Using several tools provides a much more accurate view of performance than relying on one score.
Ready to decide? Our #1 pick for 2026 is the Software.
Live price & availability on Amazon.