🛒 Best Price Today on Amazon
Prime members get fast, free shipping on everything above, plus member-only deals. New members get a 30-day free trial — cancel anytime.
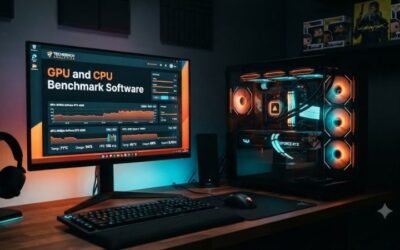
A CPU GPU stress test online is useful when you need a quick performance or stability check without installing software. Browser tools can load processor cores, WebGL or WebGPU graphics, and rendering pipelines, but they cannot replace native diagnostics for temperatures, clock speeds, power draw, or maximum hardware stress.
Quick answer: For most people in 2026, the best cpu gpu stress test online is the Online Tool — our #1 rated choice. See the full ranked comparison, alternatives and buying advice below.
Best Online CPU and GPU Stress Tests at a Glance
| Online Tool | Best For | Main Workload | Installation |
|---|---|---|---|
| PCBenchmark Online | Overall CPU and GPU check | CPU, GPU, memory | None |
| SilverBench | Dedicated CPU testing | Multicore JavaScript rendering | None |
| SystemCheck CPU Stress Test | CPU throttling trends | Sustained multicore load | None |
| Basemark Web 3.0 | Browser and graphics benchmarking | JavaScript, WebGL, shaders | None |
| MotionMark 1.3.2 | Browser graphics performance | Canvas, SVG, CSS graphics | None |
| Volume Shader BM | Dedicated GPU stress | WebGL shader workload | None |
PCBenchmark Online
Best For: Testing CPU and GPU together in one browser session
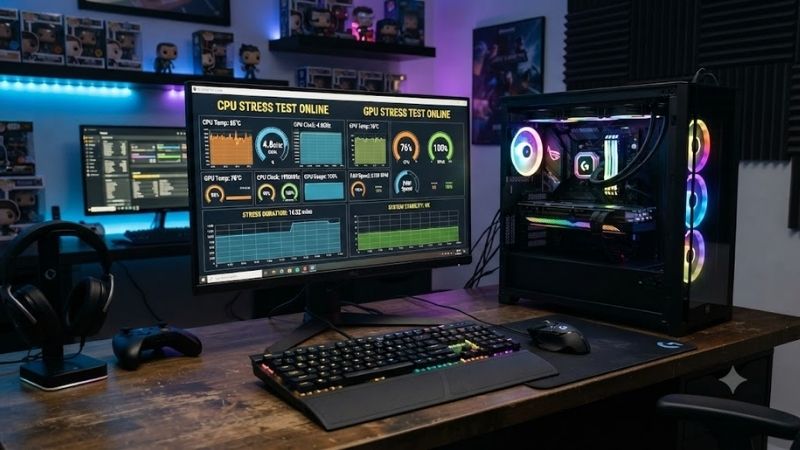
PCBenchmark Online is one of the more convenient choices when the goal is to check several parts of a computer without installing separate utilities. Its browser-based stress test applies CPU, GPU, and memory-related workloads locally and produces performance and stability information from a single test sequence.
The combined approach makes it particularly useful after buying a computer, changing drivers, adjusting cooling, or troubleshooting general slowdown. Instead of beginning with separate CPU and graphics tools, users can first run one broad test and identify whether processor or graphics behavior deserves additional investigation.
The service uses browser-accessible graphics technology for GPU workloads, so the result depends partly on browser support, operating system configuration, and graphics drivers. This is an important limitation because a browser benchmark measures the complete browser-to-hardware path rather than isolating the GPU like a dedicated native stress application.
For quick diagnostics, that limitation is acceptable. A browser-based test can expose obvious instability, severe performance loss, or unexpected slowdown without requiring administrator access. It is especially useful on shared PCs, laptops, school systems, or temporary machines where installing benchmarking software is inconvenient.
Key Features
- Combined CPU and GPU testing
- Browser-based memory checks
- No software installation
- Sustained load testing
- Performance stability reporting
- WebGPU-based graphics workloads where supported
- Shareable test results
- Suitable for laptops and desktops
What Makes It Different
The main advantage is consolidation. Many browser tools target either CPU or graphics performance, while PCBenchmark Online attempts to provide a broader system test. This makes it a useful first stop before moving to more specialized benchmarks when one component appears to be underperforming.
Pros
- Tests several system areas
- No installation required
- Easy starting point for troubleshooting
- Useful performance stability information
- Works well for quick comparisons
Cons
- Browser limitations affect results
- Cannot replace hardware monitoring software
- Does not provide the same load as native stress utilities
Use Case: Quick PC checks, troubleshooting, driver verification, laptop testing, and comparing system behavior before and after configuration changes.
Who It’s For: Users who want one simple online test before running separate CPU or GPU diagnostics.
SilverBench
Best For: Browser-based multicore CPU stress testing
SilverBench is focused specifically on processor performance. It runs JavaScript-based photon-mapping workloads directly in the browser and can distribute work across multiple CPU cores. The service includes normal benchmark, extreme, and stress modes, allowing users to choose between quick scoring and sustained processor load.
Because SilverBench uses the CPU rather than the graphics processor, it is useful when diagnosing processor cooling, sustained multicore performance, or differences between power profiles. Laptop users can also compare plugged-in and battery operation to see how aggressively the system changes CPU performance under different power conditions.
The stress mode can maintain processor activity long enough to make cooling behavior more noticeable. Fans may increase speed as CPU load rises, and performance may change if the processor reaches power or temperature limits. The browser itself cannot directly provide the detailed temperature telemetry available from dedicated monitoring applications.
Results are also affected by browser choice and JavaScript execution performance. For meaningful comparisons, users should keep the browser version, operating system, background applications, and test mode consistent. Comparing scores generated under completely different software conditions can lead to incorrect conclusions about CPU performance.
Key Features
- CPU-only browser workload
- Multicore testing
- Standard benchmark mode
- Extreme test mode
- Stress test mode
- JavaScript-based rendering workload
- No GPU required
- No installation required
What Makes It Different
SilverBench is useful because it stays focused on the processor rather than combining CPU and graphics results into one score. Users can repeatedly run the same CPU-specific workload after changing cooling, power settings, BIOS configuration, or laptop operating modes without installing a full benchmark package.
Pros
- Dedicated CPU testing
- Multicore load
- Easy repeat testing
- Stress mode included
- Works without installed utilities
Cons
- Browser performance affects scores
- Cannot directly read temperatures
- Not equivalent to heavy native CPU stress software
Use Case: CPU performance comparisons, laptop power testing, cooling checks, and quick multicore stability assessments.
Who It’s For: Users who specifically want an online processor test rather than a complete PC benchmark.
SystemCheck CPU Stress Test
Best For: Checking sustained CPU slowdown and throttling trends
SystemCheck approaches browser CPU testing by keeping every reported logical processor busy for a sustained period and watching how performance changes over time. Its standard CPU stage runs for about a minute, while deeper testing can hold the processor under load longer to expose power or cooling-related slowdown.
This trend-focused approach is useful because peak benchmark scores do not always reveal thermal behavior. A laptop may begin a test at high performance and then reduce speed after the cooling system becomes saturated. Watching the difference between early and settled performance can provide more useful information than one final score.
The service uses browser Web Workers to apply work across available logical cores and samples performance repeatedly during the run. It cannot access processor temperature sensors directly, so performance decay is used as an indicator rather than proof of thermal throttling. Native monitoring remains necessary for confirming the cause.
SystemCheck therefore works best as a screening tool. If repeated tests show a large decline under consistent conditions, users can investigate cooling, power settings, dust buildup, laptop mode, BIOS behavior, or background processes with dedicated hardware-monitoring software rather than assuming the browser test alone identifies the problem.
Key Features
- Sustained multicore CPU load
- Uses browser Web Workers
- Repeated performance sampling
- Measures performance decay
- Longer deep-test option
- No installation or account required
- Works in modern desktop browsers
What Makes It Different
Instead of emphasizing only the highest score achieved, SystemCheck focuses on whether CPU performance remains consistent as the test continues. This makes it particularly useful for thin laptops and compact PCs where cooling limitations may appear only after the processor has remained busy for a while.
Pros
- Useful sustained-load behavior
- Shows performance changes over time
- No installation required
- Good for laptop testing
- Easy to repeat after cooling changes
Cons
- Cannot read CPU temperature
- Browser workload is lighter than native testing
- Performance loss can have several causes
Use Case: Laptop throttling checks, cooling comparisons, power-mode testing, and identifying performance decay during sustained CPU work.
Who It’s For: Users more interested in sustained processor consistency than a single benchmark number.
Basemark Web 3.0
Best For: Testing browser CPU and graphics performance together
Basemark Web 3.0 is a broad browser benchmark containing core JavaScript workloads alongside WebGL, shader, canvas, SVG, and graphics stress tests. Its graphics suite includes WebGL 1 and 2 workloads, shader pipeline testing, draw-call stress, geometry stress, and other browser rendering tests.
This breadth makes Basemark useful for comparing complete browser performance rather than only raw CPU or GPU capability. A result reflects the interaction between processor, graphics hardware, driver, browser engine, and operating system. That makes it particularly relevant when troubleshooting web applications or browser rendering performance.
The benchmark is less suitable as a prolonged thermal burn-in test. Its purpose is to score browser performance across multiple workloads rather than keep one hardware component at maximum load indefinitely. Users investigating cooling or overclock stability should therefore combine Basemark with a dedicated sustained CPU or GPU test.
For accurate comparisons, close unnecessary tabs and applications and run the same browser version each time. Even display resolution can influence graphics workloads, so benchmarking two computers under very different browser windows or screen configurations can make the final scores less directly comparable.
Key Features
- CPU-oriented browser tests
- WebGL 1 and WebGL 2 testing
- Shader pipeline benchmark
- Draw-call stress testing
- Geometry stress testing
- Canvas and SVG workloads
- Combined benchmark score
- Runs completely online
What Makes It Different
Basemark Web covers a much broader set of web technologies than simple stress pages. It is useful when users want to understand the overall performance of a PC as a browser-rendering platform rather than isolating one hardware component under an artificial maximum-load loop.
Pros
- Broad benchmark suite
- CPU and GPU-related workloads
- WebGL graphics tests
- Useful for browser comparisons
- No software installation
Cons
- Not a dedicated thermal stress test
- Results depend heavily on browser configuration
- Combined score does not isolate hardware perfectly
Use Case: Browser benchmarking, WebGL performance comparisons, driver checks, and comparing different PCs using the same browser configuration.
Who It’s For: Users who want a comprehensive web-performance benchmark rather than only a CPU or GPU stress loop.
MotionMark 1.3.2
Best For: Testing browser graphics and rendering performance
MotionMark is a graphics benchmark developed to measure how efficiently browsers animate complex visual scenes. It uses workloads involving CSS, HTML text, SVG, and canvas operations, then changes scene complexity around the point where the browser can no longer maintain its target rendering rate.
Version 1.3 improved behavior across devices with different display refresh rates by adapting its target to the browser’s detected animation frequency. That detail is important on modern gaming monitors because a browser running at 120 or 144 Hz has less time available to render each frame than one operating at 60 Hz.
MotionMark should not be interpreted as a pure graphics-card benchmark. CPU performance, browser engine, operating system, display refresh behavior, and graphics drivers all contribute to the result. Its strength is measuring browser graphics performance as a complete system rather than isolating GPU shader throughput.
For gaming PC owners, MotionMark is most useful when investigating unusual browser stutter, hardware acceleration issues, or performance differences between browser versions. It can also complement a dedicated WebGL GPU stress test by showing whether graphics performance remains strong across common web-rendering techniques.
Key Features
- Browser graphics benchmark
- Canvas workloads
- SVG rendering
- CSS graphics tests
- Adaptive scene complexity
- Refresh-rate-aware testing
- Repeatable score
- Runs without installation
What Makes It Different
MotionMark focuses on how much graphical complexity a browser can animate smoothly rather than simply rendering thousands of identical 3D objects. That makes the test more representative of browser rendering performance while remaining useful as a quick graphics-system check on desktops, laptops, and tablets.
Pros
- Strong browser graphics testing
- Useful on high-refresh displays
- Covers several web rendering methods
- Easy to repeat
- No installation required
Cons
- Not a pure GPU benchmark
- Shorter than dedicated stress tests
- Browser differences can change results significantly
Use Case: Browser hardware acceleration testing, graphics troubleshooting, browser comparisons, and checking rendering performance after driver updates.
Who It’s For: Users interested in browser graphics performance rather than maximum GPU thermal loading.
Volume Shader BM
Best For: Sustained online GPU stress testing
Volume Shader BM is a browser-based graphics stress test that uses WebGL shader workloads to keep the GPU busy while measuring frame-rate behavior. It reports metrics such as current, average, minimum, and maximum FPS, allowing users to observe whether graphics performance remains stable as the GPU continues working.
The test relies heavily on fragment-shader processing and volumetric rendering, making it more GPU-focused than benchmarks centered on JavaScript or DOM performance. Users can run the same workload after a driver update, cooling modification, or graphics setting change and compare how sustained frame rates behave under similar conditions.
A browser test still cannot provide the same hardware control as native GPU tools. Power limits, temperatures, hotspot readings, memory temperatures, and detailed clock behavior require separate monitoring software. Volume Shader BM should therefore be treated as a quick stability signal rather than a complete graphics-card diagnostic.
Consistency matters when comparing runs. Use the same browser, resolution, power mode, test duration, and background workload. Laptop GPUs are especially sensitive to whether the machine is plugged in, while browser tabs using video or hardware acceleration can consume GPU resources and distort the result.
Key Features
- WebGL-based GPU stress workload
- Volumetric shader rendering
- Live FPS monitoring
- Minimum and maximum FPS information
- Sustained graphics load
- No software installation
- Desktop and mobile compatibility
- Useful for repeat testing
What Makes It Different
Volume Shader BM focuses more directly on sustained graphics processing than general browser benchmarks. This makes it one of the more useful browser choices for checking whether GPU performance remains stable under continuous shader load without first downloading a large native benchmark package.
Pros
- Dedicated GPU-focused workload
- Sustained testing
- Live performance metrics
- No installation
- Useful after driver or cooling changes
Cons
- Cannot read detailed GPU telemetry
- Browser and resolution affect results
- Native stress software can create heavier loads
Use Case: Driver testing, quick GPU stability checks, laptop graphics testing, and comparing sustained frame-rate behavior.
Who It’s For: Users who want a fast browser-based graphics stress test before moving to dedicated desktop tools.
How to Run an Online CPU GPU Stress Test Correctly
Close unnecessary applications before testing because background software can consume CPU time, GPU resources, and memory. Keep the computer plugged into power if it is a laptop and disable unnecessary battery-saving modes. Use the same browser and settings whenever comparing results before and after a hardware or software change.
Run a short baseline test first, then repeat the same workload after the system has warmed up. If performance falls significantly, investigate temperatures, power limits, cooling, or background processes with dedicated monitoring software. A browser score by itself cannot determine exactly why performance changed during sustained load.
Online Stress Test vs Native Stress Test
Online stress tests are convenient because they need no installation and usually begin within seconds. They work well for quick checks, browser performance comparisons, and computers where software installation is restricted. They are also easy to stop because closing the browser tab immediately ends the browser workload.
Native tools provide much deeper hardware access. They can usually create heavier workloads while monitoring clocks, temperatures, voltage, fan speed, power consumption, and hardware errors. Use browser testing for quick screening, then move to dedicated software when validating overclocks, cooling systems, or serious stability problems.
FAQ
Can an Online Stress Test Fully Test a CPU and GPU?
Not completely. Browser tests can create significant CPU and graphics workloads, but browser security and API limitations prevent the same level of hardware access available to native applications. They are excellent for quick comparisons and troubleshooting but should not be the only validation tool for overclocking or hardware stability.
Can a Browser Stress Test Show CPU Temperature?
Normally no. Standard browser APIs do not provide direct access to CPU temperature sensors. A website may observe performance changes that suggest throttling, but confirming temperature requires hardware-monitoring software. Performance slowdown alone cannot prove that heat is the cause because power limits can produce similar behavior.
Is an Online GPU Stress Test Safe?
Browser workloads operate through graphics APIs and can make the GPU work hard, so fans may become louder and temperatures may rise. Modern hardware includes protective controls, but users should stop any test if the system becomes unstable, produces visual corruption, or behaves abnormally rather than continuing simply to complete a benchmark.
Which Online Tool Is Best for CPU Testing?
SilverBench is a strong choice when the goal is a straightforward multicore CPU benchmark and stress workload. SystemCheck is more useful when you want to observe how performance changes during sustained load. Running both can provide more information than relying on a single browser score.
Which Online Tool Is Best for GPU Testing?
Volume Shader BM is more directly focused on sustained GPU shader load, while MotionMark examines browser graphics behavior across different rendering techniques. Basemark Web also provides a broader graphics suite. The best choice depends on whether you want stress, browser rendering analysis, or an overall benchmark.
Are Online Benchmarks Accurate?
They can be repeatable when conditions remain consistent, but results are influenced by browser version, extensions, operating system, driver configuration, resolution, refresh rate, and background applications. Compare results using the same environment and avoid treating scores from different browsers as direct hardware-only comparisons.
Conclusion
The best CPU GPU stress test online depends on what you need to diagnose. PCBenchmark Online provides a broad system check, SilverBench and SystemCheck focus on CPU behavior, Basemark and MotionMark measure browser graphics performance, while Volume Shader BM provides a more focused sustained GPU workload without requiring an installation.
Ready to decide? Our #1 pick for 2026 is the Online Tool.
Live price & availability on Amazon.